You would think that it would be easy to graph an equation/function on a graphing calculator. However, despite it being easy to learn, it is not immediately obvious how to find and use this functionality.
This guide will show you everything you need to know about graphing equations, and applies to every model of the TI-84. This includes the TI-84 Plus, TI-84 Plus Silver Edition, TI-84 Plus C Silver Edition, and TI-84 Plus CE calculators.
Entering Your Equations
Before you can graph anything, you will need to type your equations into your calculator.
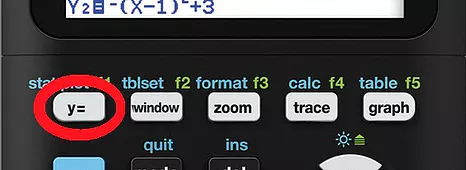
Press the [y=] button on your calculator.
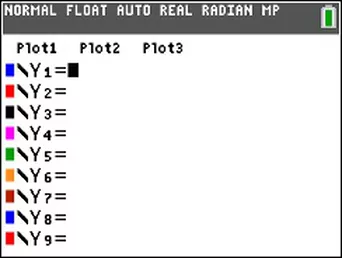
You will now see the screen shown below. This is where you are able to enter all of the equations that you would like to graph.
So, for example, if I wanted to enter the equations y=4x+3 and y=x^2+3, I would do it like this: (using the arrow keys to switch to different equation slots)
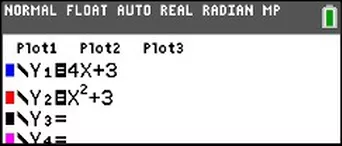
To type the “X”, press the [X,T,Θ,n] button on your calculator.

Notice that I am not typing in the “y=” part, as the calculator does that for us (Y1=, Y2=, etc).
Keep in mind that all of your equations must have the Y term isolated on one side.
For example, if we had an equation such as Y+4=X, we would have to subtract 4 from both sides to get Y=X-4, so that we could type it into our calculator as “X-4”.
You can graph up to 10 equations at a time, by typing them into each of the slots listed on the Y= screen. You can navigate around using the arrow keys.
Graphing Your Equations
Now that you have entered your equations into the calculator, let’s see what they look like!
When you have finished entering the equations, press the [graph] button.

As soon as this button is pressed, your calculator will get to work drawing your equations on the graph screen!
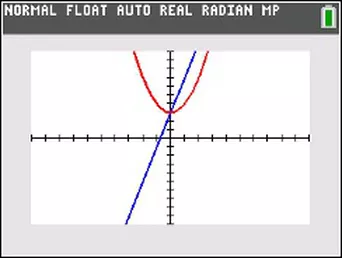
To change the equations you entered, just press the [y=] button again.
To clear the equations you entered, press [y=], scroll to the equation you want to delete, and press the clear button.
If you are unable to see the function you typed in, you may need to adjust your viewing window, as described in the next section.
Adjusting the Viewing Window
The best way to exactly set up the viewing window is to use the [window] button on your calculator (it is right next to the [y=] button).
Upon opening it, you will see several scary-looking numbers. Thankfully, you have this tutorial to guide you. The following diagram should help you understand exactly what these numbers mean:

- Xmin and Xmax: these are, respectively, the smallest and largest values on the x-axis the calculator will display.
- Ymin and Ymax: these are, respectively, the smallest and largest values on the y-axis the calculator will display.
- Xscl and Yscl: This is the distance between the tick marks on the x-axis and y-axis, respectively.
- Xres: This determines the resolution of the graph. It can be set to any integer from 1 to 8. In simple terms, the larger the number, the faster the graphing, but the worse the quality. In all my years of using these calculators, I have never changed this value, and I doubt you will ever have to either.
- ΔX and TraceStep: This is another value you will probably never change. ΔX is always half of TraceStep, which determines the movement of your cursor on the graph screen when in “trace mode”. You can access this mode by pressing the [trace] button on your calculator, and it allows you to trace the graph, and see the points that make it up. TraceStep controls the X-value jump when you are tracing a function in this trace mode.
If you would like a simpler solution, you can always press the [zoom] button on your calculator (it is next to the [window] button), and choose an option from the menu.
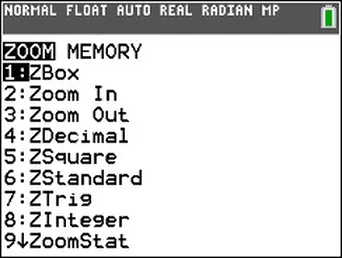
The most popular options are ZStandard, which resets the viewing window to original settings, and Zoom In/Zoom Out, which zooms in and out.
If this article helped you out, do be sure to check out the rest of the articles we have here on TI84CalcWiz! We have games you can put on your calculator, programs to make your life easier, and more!